Regression Breakout Map — Volatility Contraction Indicator for MetaTrader 5
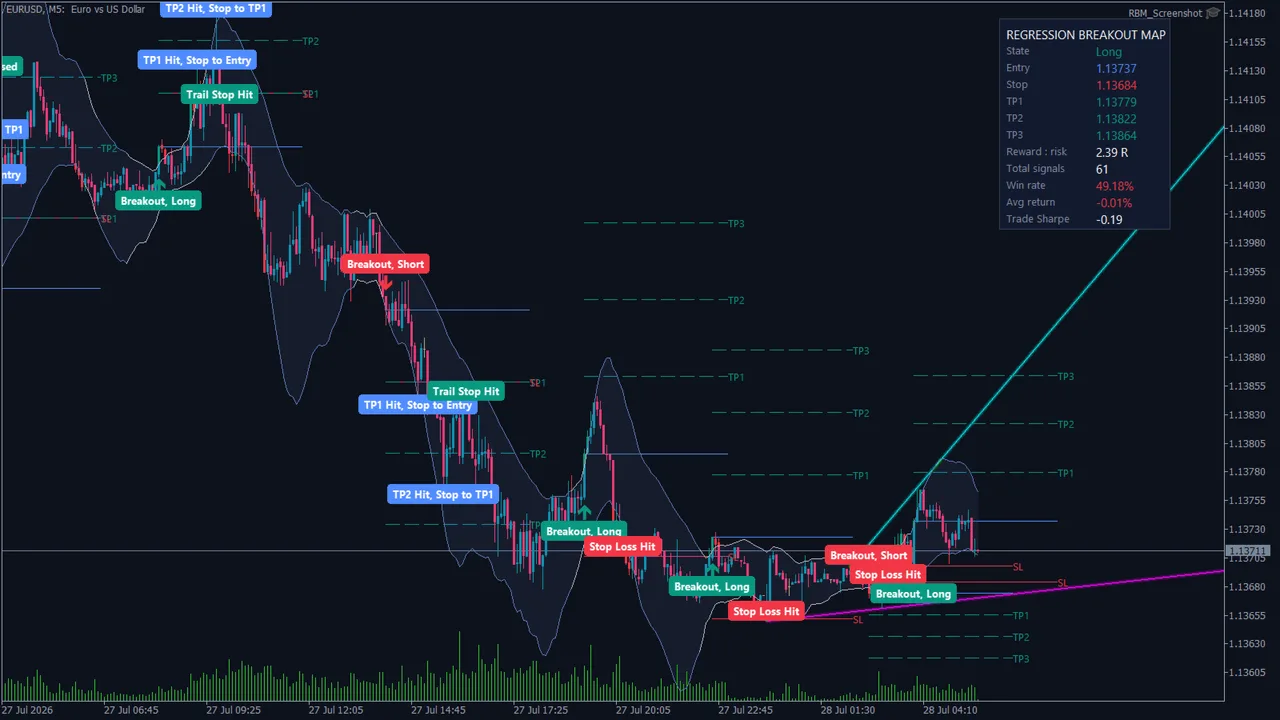
Regression Breakout Map finds volatility contractions and marks the breakout from an adaptive linear regression channel — then draws the complete trade map on your chart: entry, stop loss, and a TP1 / TP2 / TP3 target ladder with a stop that ratchets forward as each target is reached.
Signals are confirmed on bar close and do not repaint.
How it works
- Adaptive regression channel — least-squares linear regression with standard deviation bands that tilt with the trend, rather than horizontal levels that ignore direction
- Contraction detection — channel width is ranked against its own recent range, so a squeeze is identified relative to what is normal for that market, not against a fixed number
- The breakout — expansion out of the contraction is what triggers the signal
- The map — entry arrow, stop loss, three take-profit targets, and a stop that moves up as each target is hit
On the chart
- Live trade panel — entry price, current stop, target prices and reward-to-risk ratios
- Performance tracking — win rate, average return and Sharpe ratio for the signals it has produced on that chart
- Pivot trendlines drawn from swing highs and lows
- Alerts — terminal popup, push notification to your phone, email and sound
Configuration
Input groups cover the regression model, contraction metrics, target architecture, pivot trendlines, colours, signals and alerts, dashboard, engine and branding.
Requirements
- MetaTrader 5
- Any symbol, any timeframe
Delivery and licensing
Sold, licensed and delivered through the MQL5 Market, including activations, automatic updates and the MQL5 buyer guarantee. A free demo is available.